Importing data into QIIME 2
Contents
5. Importing data into QIIME 2
A QIIME 2 analysis almost always starts with importing data for use in QIIME 2. This step creates a QIIME 2 archive from data in another file format, such as fastq or biom. To import data into QIIME 2, you need to define the file type and semantic type of the data.
I’ll get straight to the point: in addition to being the first step in a user’s QIIME 2 analysis, importing is often the most challenging step. The reason it’s challenging is that there are tens or even hundreds of different file types that users would like to use with QIIME 2, and many file formats in bioinformatics are poorly defined. For example, the ete3 phylogenetic analysis and visualization toolkit recognizes (as of this writing) 11 different variants of the newick file format. A newick file doesn’t include explicit information in it on which of these variants it is, so it’s up to the person working with the file to know that. A user importing data into QIIME 2 needs to have a very good understanding of what format their data is in, and then learn how to provide that information to QIIME 2.
This chapter will provide an overview of importing data into QIIME 2, focused on the most common importing tasks.
5.1. Why is importing necessary?
Importing fastq files is the most common importing task among QIIME 2 users, so I’ll discuss why importing is necessary using fastq as an example. Fastq files store sequence and associated sequence quality information. They use a clever approach for representing quality information that enables the quality information to be represented in the same number of characters as the sequence itself. For example, here is a single sequence and quality record from a fastq file:
@M00176:65:000000000-A41FR:1:1101:9905:3163 1:N:0:0
AACCAGCACCTCAAGTGGTCAGGATGATTATTGGGCCTAAAGCATCCGTAGCCGGATCTGTAAGTTTTCGGTTAAATCTGTACGCTCAACGTACAGGCTGCCGGGAATACTGCAGATCTAGGGAGTGGGAGAGGTAGACGGTACTCGGTAG
+
AHAABBABFBFFGGGDGBGGGECFGHHHHHHHHGHHGGHHHHHFHHHGFHGGHGGGGGHHHHHFHHHHHGGGGGHHHHHGHHHHFGEEGHGHHHGGHGHGGHGGGGGHHHHHHHHHHHHFHHGGGCFFGHGGGGFFDGGFG<GEHHGGG/C
The line beginning with the @ symbol indicates the beginning of a new sequence record. It is followed by an identifier for this sequence that, in this example, was generated during an Illumina MiSeq sequencing run. The next line contains the sequence. The line beginning with the + symbol indicates the end of the sequence, and the last line indicates the quality of each base call in the sequence. Each of the characters on this line represents an encoded Phred quality score. For example, in this fastq file A might represent a quality score of 32, and H might represent a quality score of 39. You can refer to a simple translation table such as this one, to decode the quality scores. That seems simple enough - so what’s the problem? Well, it starts with the fact that the encoding of these quality characters isn’t necessarily the same across different fastq files. In another fastq file, A might represent a quality score of 1, and H might represent a quality score of 8. You could look again those values up in a translation table, but it would have to be a different translation table this time. The major problem here though is that the fastq file itself doesn’t contain explicit information about what encoding scheme was used. When trying to interpret the information in the file, without additional context you won’t know if A represents a high quality base call or a low quality base call. Ouch! There are some approaches that can be applied to infer how scores are encoded, but they are not completely reliable and it can be computationally expensive to figure out. The burden is on the person working with the fastq file to know which encoding scheme is used.
One of the core design goals of QIIME 2 was that it should keep track of the meaning of data in the files it’s using, such as how quality scores are encoded in fastq files. This removes that burden from the user, and ensures that someone who encounters the data at a later time (for example, you or your boss in five years) will know how to interpret it. Continuing with the example of fastq files, because the quality score encoding scheme isn’t stored in fastq files, that means that QIIME 2 needs to keep track of it alongside the data. That’s where our QIIME 2 artifacts come in. Remember, these are just .zip files with a different extension (.qza). They store the fastq data (in the data/ directory), but also metadata that explicitly defines how quality scores are encoded. When a user imports fastq files into QIIME 2, they must tell the system what encoding scheme is used. QIIME 2 will keep track of it from there, and until you choose to export fastq files from a QIIME 2 artifact you will unambiguously know what encoding scheme is used in your fastq files.
Importing is the step when you must provide specific information about your data to QIIME 2, and sometimes that information can be challenging to compile. The good news is we’re here to help on the QIIME 2 Forum and we frequently help users navigate this tricky step. You can find the most recent questions about importing data on the QIIME 2 Forum under the import tag. We’re also working on tools that will simplify the most common types of data imports in QIIME 2. Because of the huge number of file formats in bioinformatics though, it’s not a trivial task.
5.2. Determining how to import your data
When you import data into QIIME 2 you must provide the semantic type of the data and the file format (or file type) that the data is represented in. These concepts were contrasted earlier - refer back to that discussion now if you need to.
While most users begin their QIIME 2 analysis with raw sequencing data, you can import data at any step of a QIIME 2 analysis. For example, another common approach users take is importing feature tables from .biom files. This might happen if a user wishes to process their raw data with another analysis tool, but then use QIIME 2 for visual data exploration and statistical analysis.
The first step in determining how to import your data is figuring out what it is that you’re trying to import. Fig. 5.1 presents a flow chart that will get you get started. Follow the references in the flow chart to other sections in this chapter. If you suspect that you may have a particular type of data but are not sure, refer to the section that the flowchart would direct you to if you had that type of data. Each section will begin with a definition the type of data.
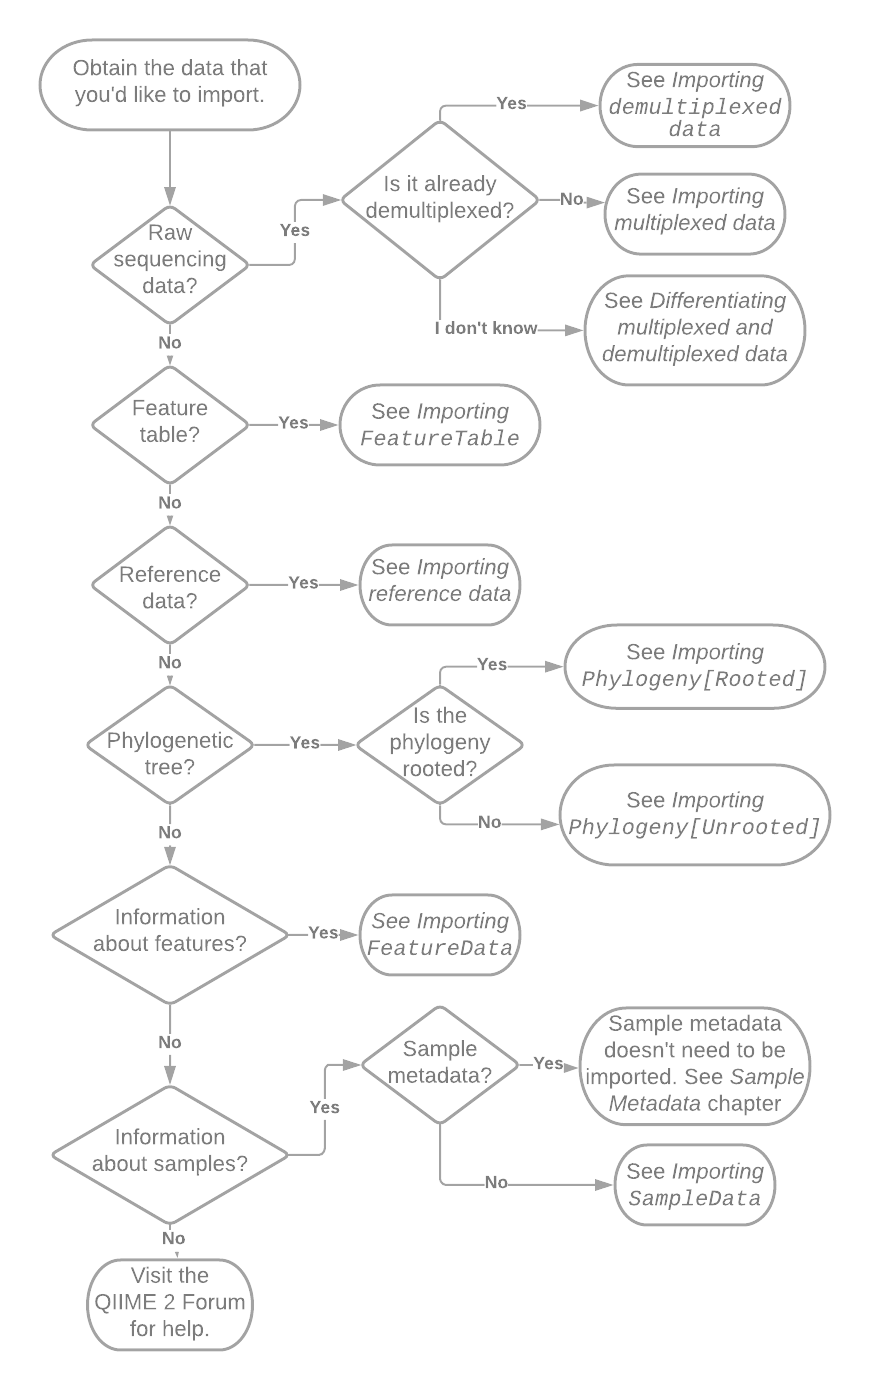
Fig. 5.1 Flowchart illustrating initial decisions made during importing. Pointers such as “See Importing SampleData” reference other sections of this chapter or book.
5.2.1. Discussion and instructions for importing specific data
In this section I discuss and present instructions for importing specific types of data into QIIME 2. You don’t need to read this section all the way through - I recommend that you identify the section that is relevant to your current need using Fig. 5.1, focus on that section, and then move on from importing. Since there are a lot of QIIME 2 specific details needed for importing, it’s unlikely that you’ll retain more than what you immediately need so just treat this section as reference material.
5.2.1.1. Importing raw sequence data
Raw sequencing data refers to data that has undergone no processing or minimal processing since it was generated on the sequencing instrument. As of this writing, this is most commonly represented in .fastq files in one of a few different fastq format variants. .sff files, and pairs of .fasta and .qual files are other raw sequencing data formats.
5.2.1.1.1. Differentiating multiplexed and demultiplexed data
Raw microbiome data typically exists in one of two forms: multiplexed or demultiplexed. In multiplexed data, sequences from all samples are grouped together in one or more files. In demultiplexed data, sequences are separated into different files based on the sample they are derived from. The process of demultiplexing, when multiplexed data is processed into demultiplexed data, will be discussed in the next chapter. Briefly, data can be demultiplexed before it’s delivered to you, or it can be delivered still multiplexed in which case you can use QIIME 2 to demultiplex the data. It doesn’t really matter whether the data you receive is multiplexed or demultiplexed: there are benefits and drawbacks to each.
The number of files that you are starting with is the key to determining whether your data are multiplexed or demultiplexed. In QIIME 2, as of this writing, we primarily support importing of Illumina sequence data, so this discussion focuses around Illumina fastq data.
Most Illumina sequencing runs are paired-end, meaning that sequence reads are generated in two directions: the “forward reads” begin at the 5’ end of the amplicon, and the “reverse reads” begin at the 3’ end of the amplicon. These reads are stored in separate files, usually designated with an R1 (for the forward reads) somewhere in the file name or R2 (for the reverse reads) somewhere in the file name. In some cases, there may also be one (or less commonly two) “index” or “barcode” read files, designated with I1 in the filename (or I1 and I2 in the names of separate files).
If you have between one and four .fastq files, it’s almost certain that you have multiplexed data. The sequence data from all of your samples is contained in the R1 files if you performed a single-end sequencing run, or in the R1 and R2 files if you performed a paired-end sequencing run. If you have an I1 file, that contains the sequence barcodes which during PCR were added to the sequences on a sample-specific basis. If you also have an I2 file, this means that a dual-barcoding scheme was used for associating sequences with samples. In either case, the single barcode or the combination of forward and reverse barcodes define which sample a given sequence was isolated from. Refer to Importing multiplexed data to learn how to import your data.
If you have many .fastq files, your data are likely demultiplexed. In this case, you’ll typically see either an R1 or a pair of R1 and R2 files for each of your samples. Often you’ll be able to recognize your sample identifiers in the filenames, though there is typically a lot of additional information in there as well. Refer to Importing demultiplexed data to learn how to import your data.
If you’re still unsure whether your data is multiplexed or demultiplexed, get in touch on the QIIME 2 Forum and include a list of your .fastq filenames.
5.2.1.1.2. Importing demultiplexed data
Because the sequences in demultiplexed sequence data are already associated with the samples they were isolated from, during the importing step you must make QIIME 2 aware of that association. Beginning with demultiplexed sequence data can be convenient because you don’t need to understand how sequences were barcoded in order to work with them. Whoever provided you with the sequences already used the barcodes to assign sequences to samples. This can be very convenient if a barcoding strategy was applied that is unsupported by QIIME 2 (e.g., because it’s new or uncommon). Informing QIIME 2 which samples are associated with which files can be a bit labor intensive however. Having a little bit of experience with regular expressions or computer programming can really help you to carry out this step, but it’s not required.
The semantic type of demultiplexed single-end sequence data is SampleData[SequencesWithQuality]. The semantic type of demultiplexed paired-end sequence data is SampleData[PairedEndSequencesWithQuality]. If you have only files with R1 in their names, your data are single-end. If half of your files have R1 in their names, and the other half have R2 in their names, your data are paired-end.
The import format can be one of a few options. If your files are provided in CASAVA 1.8 format, there are two fastq.gz files for each sample in the study, each containing the forward or reverse reads for that sample. The file name includes the sample identifier. The forward and reverse read file names for a single sample might look like L2S357_15_L001_R1_001.fastq.gz and L2S357_15_L001_R2_001.fastq.gz, respectively. The underscore-separated fields in this file name are:
the sample identifier,
the barcode sequence or a barcode identifier,
the lane number,
the direction of the read (i.e. R1 or R2), and
the set number.
5.2.1.1.3. Importing multiplexed data
5.2.1.2. Importing a FeatureTable
5.2.1.3. Importing reference data
5.2.1.4. Importing phylogenetic trees
5.2.1.4.1. Importing Phylogeny[Rooted]
5.2.1.4.2. Importing Phylogeny[Unrooted]
5.2.1.5. Importing FeatureData
5.2.1.6. Importing SampleData
5.3. Summary
QIIME 2 is more explicit about the meaning and format of data than most bioinformatics tools, and as a result we’ve had to invent some language to describe these things. This creates a bit of a circular dependency when you’re just getting started: experience with QIIME 2 helps you to understand how to import data, but you have to import data to get experience with QIIME 2. As you gain experience with QIIME 2, you’ll learn its language of semantic types and you’ll be less dependent on the flow charts and other information in this chapter. You’ll probably still refer back to importing documentation from time to time though - I certainly do.